An inexpensive in-situ assessment of membrane permeability for making easier the job of scientists
- MCS

- Dec 8, 2019
- 12 min read
Updated: Dec 8, 2019
This time I am excited to announce this publication where I participated as first author. This is in fact my first, first-author paper where I appear listed first…which is apparently important for the career of scientists. Another thing that is very important for science is to know how to describe our findings in a simple way for all type of audiences. In fact, this is pretty much the goal of this blog. Recently, I also gave my first talk for the scientific community in the AIChE 2019 in Orlando. In this post I will write what I discussed during my session and a little more. Hope you find it interesting and useful!

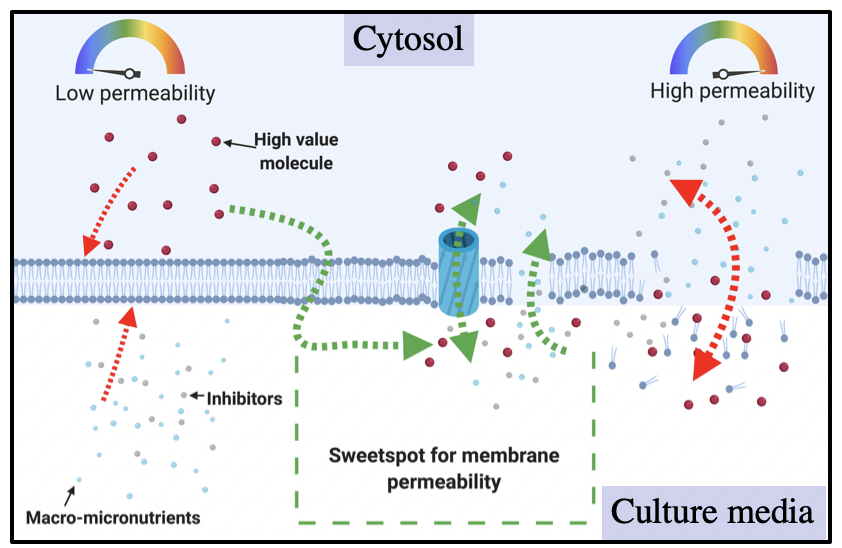
Figure 1.- Schematic representation of different levels of membrane permeability. It's shown that the modulation of this property might cause different effects on the cell. An adequate characterization of this property might enable to find the optimal level of permeability.
In our research article we described and validated a method that is simple and inexpensive for measuring membrane permeability (Figure 1) as the cells grow without tedious sampling. The simplicity of a method is often times related to its number of components and requirements of training. I’d say that as the method complexity increases, the cost associated also increases therefore inexpensive methodologies rely on simple instruments that do not require specialized trained personnel, high operation or repair costs.
Everyone wants cheaper alternatives!
Low cost alternatives are very easy to relate in our daily lives. When we do groceries every week, go out to shopping, etc. In the same way, performing experiments and especially supporting a research group cost money and the Principal Investigators (PIs) have tons of work to maintain and to improve their research. This is especially true for experimental research groups that require of buying chemicals, equipment, hire people, etc. This is also true for all companies, from startups with a few employees until the world’s largest company with a market value of $961.3 billion: Apple. Yes… your iPhone and MacBook Pro contributed to this number.
The price of commodity chemicals and products is indeed what has been ruling the industrialization and development of the World. Specifically, the low price in the production of these chemicals. To illustrate this argument in Figure 2 you could see a graph of Energy consumption in the US from the First Industrial Revolution period until 2017. It is evident that petroleum has been the largest US energy source since mid 20th century. What is important to point out is that petroleum industry started in 1861 as cheaper alternative to oil shale what promoted an oil boom and caused the proliferation of wells and decreased the price of barrel.


Figure 2.- Sources of energy and its consumption in the US. This picture was modified from the U.S. Energy Information Administration (EIA) website. eia.gov. It's shown how fossil fuels started to become more popular more than 100 years ago. Other energy sources such as nuclear, biomass and hydroelectric aren't being exploited.
In parallel, the creativity of some people also contributed with several inventions such as the steam engine (1698 by Thomas Savery), the telephone (1876 by Alexaner Graham Bell) the incandescent light bulb (1879 by Thomas Edison) and the internal combustion engine (1859-1876 by Étiene Lenoir and Nikolaus Otto). The role of finding cheaper alternatives also caused other inventions such as the alternating current (1887 by Nikola Tesla) and the first automobile that worked with a cheaper fuel than kerosene, gasoline (Karl Benz, 1885).
These inventions in terms of business worked because they made possible for society to have access to a variety of commodities at a low price!
Nowadays, fossil fuels (specifically, petroleum) are still the largest source of energy, at least in the US. At the same time, we currently face an obvious increase in the temperature of the world (Figure 3A) which has been causing devasting meteorological phenomena. Just last January, people in the Midwest, we had the experience of the Artic polar vortex (Figure 3B) which produced record low temperatures in several cities and killed at least 22 people. Other consequences of employing fossil fuels besides climate change is the amount of plastic in our oceans that has been accumulating producing garbage patches (Figure 3C) that won’t disappear just by ignoring them.


Figure 3.- Global consequences of current over-utilization of fossil fuels. (A) The exponential increase in temperature shows a similar trend that utilization of fossil fuels. Currently, we are facing some devastating meteorological consequences. (B) Temperatures experienced in the US on January 30th 2019 during polar vortex. (C) The accumulation of petroleum-based plastics have created patches of significant size in the ocean.
So…what can we do?
Greener alternatives to fossil fuels have been investigated in the last decades. In order to develop a feasible alternative to fossil fuels, they need to economically compete with petroleum, which is challenging. A simple way of finding cheap resources is looking for potential compounds that have very high abundance, are accessible and are cheap to process.
Biomass is one of the most abundant sources of energy in the world therefore it can be considered as a feasible alternative to fossil fuels. Biomass is composed of organic molecules which can be transformed into other carbon-molecules such as fuels and other commodity chemicals. The process of transforming sugars into something else is really related to mankind and seems to be working for the last 9000 years! This process is called fermentation and it is the same process employed to produce beer, wine, cheese, vinegar and more food products. This process can also be exploited to produce fuels and chemicals utilizing biocatalysts (Figure 4).


Figure 4.- Proposed green pathway for the conversion of carbon from biomass into biofuels and high value chemicals.
Of course, there are challenges for this approach, and one of the main challenges is microbial toxicity. After breaking down the biomass into simpler molecules, several inhibitors are released in the potential fermentation broth which kill the microbes that are supposed to transform the sugars into products. The general aspect of tolerance was discussed in my post #2 and a particular element related to this feature from the point of view of the microbe is of course the cell membrane. As part of my PhD project I am interested in genetically modifying the cell membrane of biocatalysts to make them more robust for these inhibitory conditions therefore we need to characterize events that happen in the cell membrane in contact with these toxic chemicals. This exposure typically produces an increase in membrane permeability (cell membrane is breaking apart) and decrease in viability (cells are dying). It's well-known that these events are indeed related to membrane damage.
The membrane permeability is one membrane property meaningful to study when characterizing the toxicity of chemicals. In fact, different studies have demonstrated the relationship between tolerance and membrane leakage (or permeability) and their connection with production of chemicals of interest. Therefore, we recognized that this membrane property is of interest to study for microbial cell factories. Ingram’s group published in 1985 a study demonstrating that membrane leakage indeed decreased tolerance and production of ethanol. Other studies and patents involving membrane permeability and methods are represented in Figure 5 and listed below in the reference section (1-3). Of course, once again, inexpensive ways to measure membrane permeability are appreciated. If you think about it, the Design-Build-Test-Learn cycle needs of streamlined methods that allow faster screening processes and decrease costs. In this way, scientist and managers can laser-focus their efforts and economic resources for different fronts of the research project or the company.


Figure 5.- Timeline of selected membrane permeability studies. These studies contributed to understand the importance of membrane leakage for production of biofuels. The development of technology also allowed the utilization of different equipments to estimate membrane permeability. Method utilized before our study was reported on 1997.
I think we have meditated enough about robust organisms to produce valuable chemicals, the utility that low-cost methods can have and the cell membrane permeability as an output of interest to characterize. Let’s briefly discuss about our published study…


Figure 6.- Schematic of methodologies for determining membrane leakage. Methodology employed since 1997 utilizes flow cytometry while the plate reader approach illustrates our proposed methodology. Degree of membrane damage can be estimated numerically without re-adjustment of settings in the equipment.
Figure 6 shows a schematic of the current method to determine membrane permeability, flow cytometry, and our proposed utilization of plate reader that can quantify membrane permeability in situ while cells are growing. Notice that flow cytometry is an instrument that counts and sorts one by one the cells in the sample. The sorting process depends on fluorescence, which is proportional to membrane damage. On the other hand, our method can’t analyze the sample at a single cell level. However, it can estimate bulk cell density, and also bulk fluorescence from the same sample. These are two metrics routinely employed in biotech laboratories. The difference is that the bulk fluorescence values are coming from membrane damage after the binding of SYTOX Green to intracellular DNA of permeable cells. The fact of numerically estimating cell density (X) and the amount of fluorescence (Y) with the plate reader suggests that we could normalized this bulk fluorescence value by cell density for each well of the micro-plate (our microplates contain 96 wells). In this way we can calculate (Z) normalized fluorescence values where Z = Y/X. The normalized fluorescence value estimates cell membrane damage (permeability) in that particular well.
In order to validate our method that clearly rely on binding events of SYTOX Green to DNA, we first put different amounts of DNA in each well of the 96-well plate. Then, we added the same amount of SYTOX Green molecule and determined bulk fluorescence. We observed a linear response of bulk fluorescence values as the concentration of DNA increased (Figure 7A). Of course, this was expected but it was positive to have a linear response in a known range of available DNA. This is a good practice for all devices that pretend to estimate something based on measurements of a signal response. In this case, we are estimated the binding of SYTOX Green with exposed DNA by quantifying bulk fluorescence. Furthermore, the signal response might also depend on, what is called in chemical engineering, a limiting factor. That means that one reactant runs out first limiting the conversion of the reaction. In this case, SYTOX Green is our limiting factor. In order to estimate the amount of SYTOX Green required to bind all available DNA from the well, we changed the concentration of SYTOX Green from 1 to 5 micromolar (µM) for each well and found that 5 µM saturated all DNA available (the highest DNA concentration in the linear range found in Figure 7A) thus this was our chosen SYTOX Green concentration to keep using (Figure 7B).


Figure 7.- Validation of output signal in plate reader for binding of SYTOX Green to exposed DNA. We determined that plate reader can estimate DNA available to bind (A). The concentration 5 µM saturated all DNA available in the well (B).
At this point we were able to claim that the plate reader could linearly quantify exposed DNA utilizing SYTOX Green however our purpose was to quantify membrane permeability. Consequently, we consulted Roth and Millard (1997) article which measured membrane permeability with our same reporter molecule utilizing flow cytometry (referred from now on as FACS). We were able to reproduce their conditions utilizing both measurements, FACS and plate reader. Figure 8 shows our data after replicating the conditions reported before in 1997 for determining membrane permeability utilizing solely FACS. We observed that the plate reader could estimate membrane permeability very similarly compared to FACS.

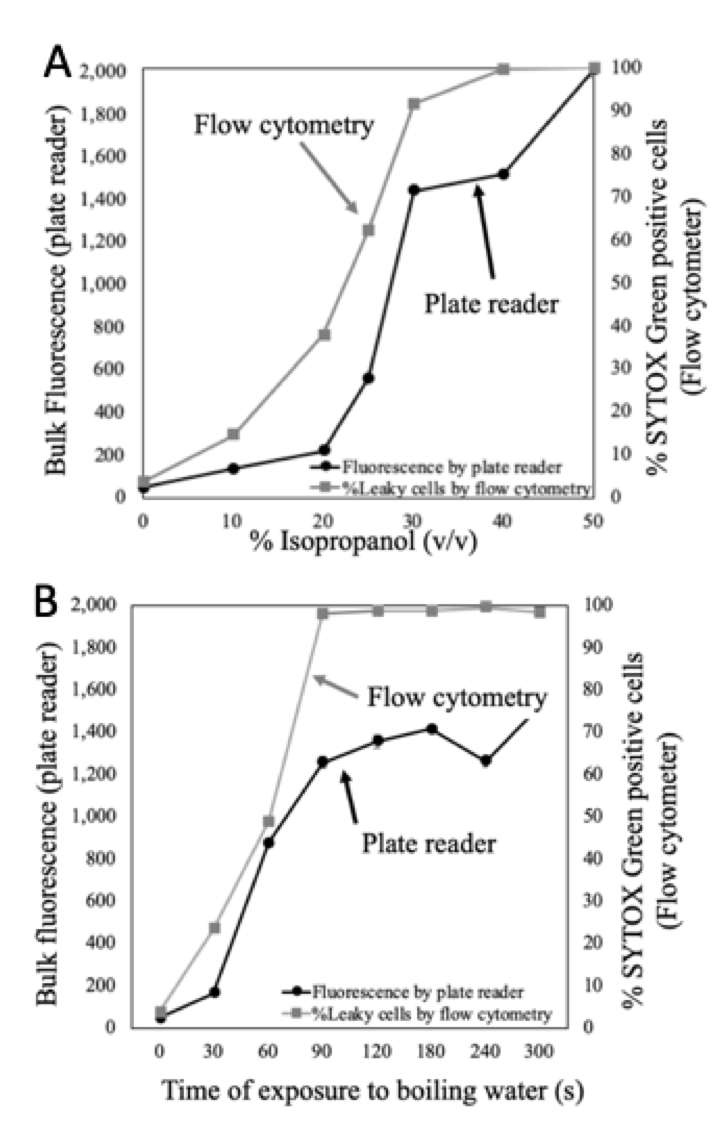
Figure 8.- Challenge conditions for altering membrane permeability from original SYTOX Green research study. (A) The exposure to different concentrations of isopropanol caused a proportional response in membrane damage. This effect was quantified by the traditional flow cytometer in addition to plate reader. (B) Both methodologies were also employed for samples exposed to boiling water during different times. Plate reader showed a similar trend compared to FACS for both tested conditions.
The last part in our validation process was to determine whether our method could collect membrane damage data automatically by simply growing the cells in the plate reader. We cultured the cells in minimal media because this type of media is cheaper therefore its useful for industrial processes. In addition, we added the found concentration of SYTOX Green 5 µM to each well. We were able to collect cell density data as well as bulk fluorescence data for 15h. We tested the toxicity of this concentration of SYTOX Green and found that it wasn’t toxic for the cells because they grew just as they did without SYTOX Green. Then, we knew we could keep going and calculate the normalized fluorescence which would be the numerical estimation of membrane damage. We did this calculation of normalized fluorescence values with the data automatically generated in the plate reader and plotted it. We observed a particular unexpected result. The shape of the monitored membrane damage signal had a spike in the first two hours of culture (Figure 9). Why?! would it be possible that we were calculating wrong this number? The cells were not even growing at that point. Actually, the cells were not growing exactly in that range of hours. This phase of the growth curves is called lag-phase and typically it doesn’t receive a lot of attention. Very interestingly, in this period of absence of growth the cells adapt to the media and increase their membrane permeability to uptake of essential minerals from the media required for starting cell growth (5). Our cultures of E. coli in only minimal media (no challenge) validated this reported phenomenon. This demonstrates that our assessment can contribute to characterize the very unknown lag-phase.

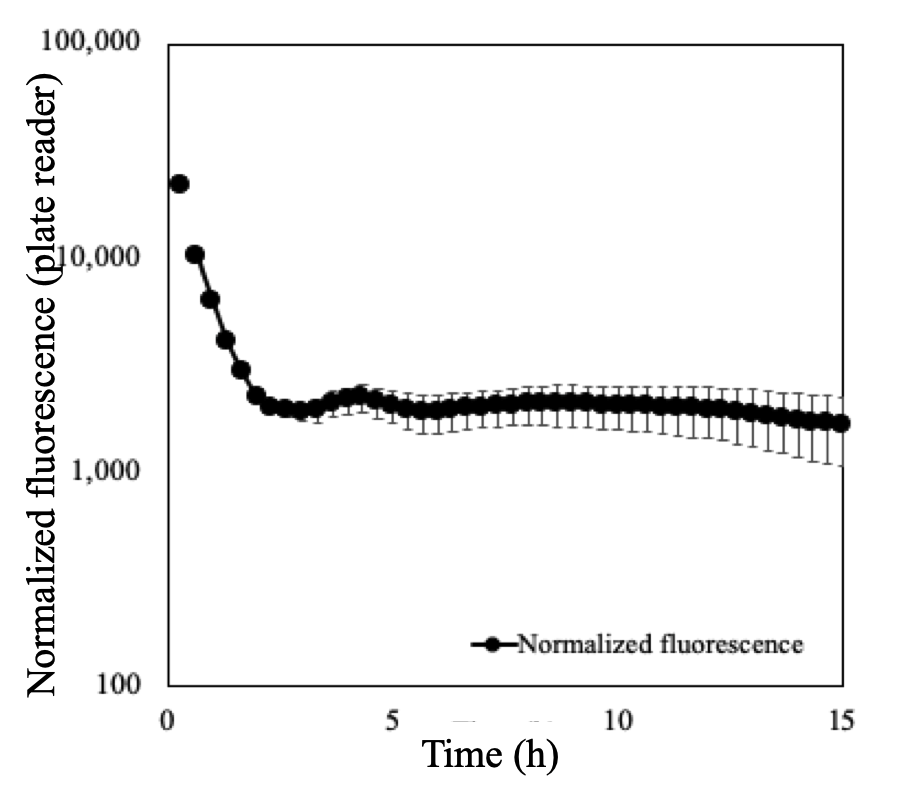
Figure 9.- Unexpected behavior of membrane permeability was detected with the normalized fluorescence plot. The cells starting to grow after 2h. The exponential growth was measured from 2 to 7h. Surprisingly, a very significant increased membrane permeability was measured in the lag phase. As the cells started to grown including the stationary phase, the levels of membrane permeability were constant. This flat values indicated no membrane damage while cells grew in minimal media only.
The idea of my research project is to perform membrane engineering in microbes and make them more robust. We employed our new assessment of membrane permeability to screen and streamline the process of selection of these strains.
Typically, molecular biology laboratories can generate hundreds of potential candidates strains thus the simplicity and automatic monitoring of membrane damage of our method is useful for other laboratories as well.
As a proof of concept, we selected five E. coli strains that had reported membrane engineering strategies known to modify membrane features. We prepared 10 mM octanoic acid in minimal media as the challenge condition.
Side note: Octanoic acid is of great interest to be produced. Next time when you go for putting gas to your car check that the most expensive gasoline contains the highest number of octanes. This is because engine fuels should have a high energy density and the eight-carbon alkane has this requirement. Similarly, octanol, the product of reducing octanoic acid, has high energy density and is compatible with existing infrastructure and engines. Good news is that octanoic acid is a product of a microbial fermentation therefore robust biocatalyst would be more suitable to increase its production and economically compete with fossil fuels.

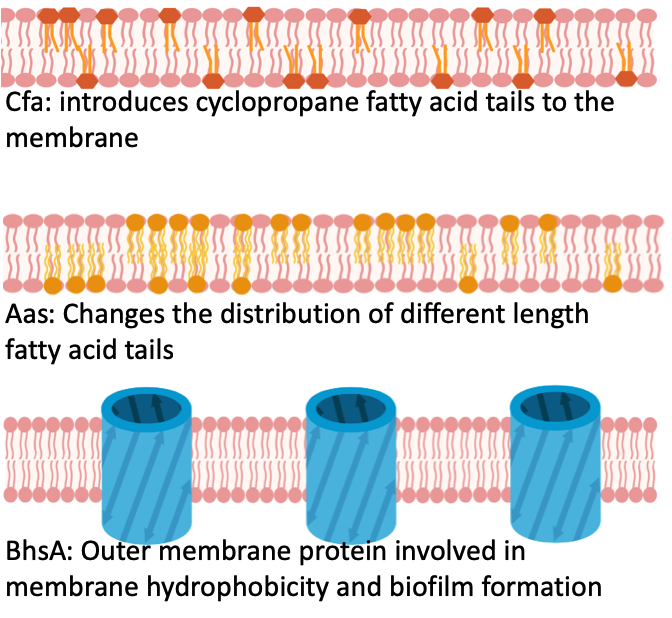
Figure 10.- Membrane modifications caused by the expression of genes utilized in this study. The three selected genes have been reported before to alter the membrane composition.
Our selection of genetically modified E. coli strains had different membrane features thus their membrane integrity (contrary to membrane leakage) might most probably vary. We deleted the aas gene and produced the strain Δaas. Likewise, we individually overexpressed the cfa gene and deleted this same gene producing the strains +cfa and Δcfa respectively. Lastly, we deleted another gene to produce the ΔbhsA strain. The fifth strain was the control strain which is just the non-modified E. coli, also referred as wild type. Figure 10 shows the reported role of each of these genes in the cell membrane. Our assessment to measure membrane permeability of these cells, with different membrane characteristics, produced Figure 11. We were able to determine the most robust strain in terms of membrane permeability and growth data and observed that membrane integrity was relevant to identify tolerant strains for octanoic acid challenge. Happily, these data demonstrated that our validated assessment, besides of revealing interesting membrane permeability events in the lag-phase, it can also screen for robust and sensitive microbes in terms of their membrane integrity.

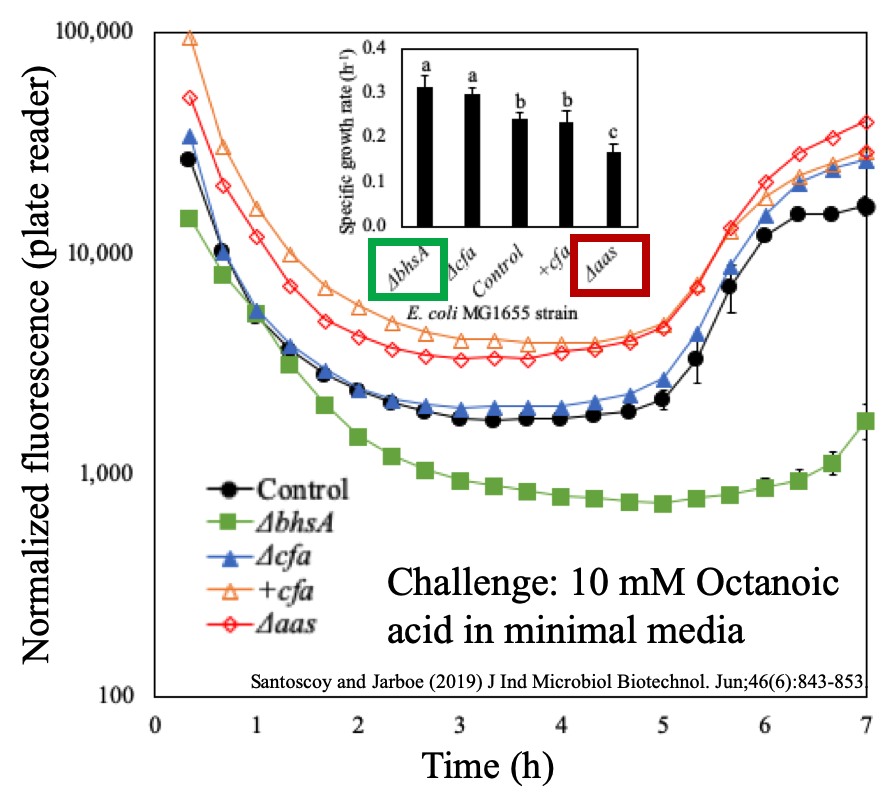
Figure 11.- Assessment demonstrated its utility for finding tolerant and sensitive strains given a challenge condition in the culture. The shape of the curve of normalized fluorescence showed that the strains with altered membrane acyl chains had also different membrane permeability and tolerance levels when exposed to octanoic acid. Deletion of BhsA caused the highest tolerance and the lowest membrane damage.
Since we observed these results, I have been utilizing this method for screening the membrane integrity of several engineered microbes and certainly has accelerated my screening for membrane integrity. I consider that this method is highly applicable for other purposes too:
Our methodology might efficiently identify the most permeable engineered strain which might be the best for the secretion of recombinant proteins.
Our methodology might contribute to understand membrane permeability in the field of antibiotic resistance
Membrane permeability as output enables the characterization of membrane physiology processes which are often times linked to vital cellular functions.
Other applications that involve cell membrane and nucleic acids could benefit from this methodology.
Finally, our published study also contains a section with a cost-analyses of this methodology against the traditional flow cytometer. For checking the details please read our study (4) listed in the references. Spoiler alert!. Our method cut down the total price at least by half without considering the inconvenient timepoints of sampling while utilizing FACS.
I would like to end this post with the reflection of the importance of characterization. From reading the instructions of frozen food until the understanding of basic science questions, knowledge about how something works is essential.
The emergency of finding alternatives to fossil fuels, besides other alarming realities such as diseases without cure, food supply, etc. illustrate that we must start to utilize the resources we have around to their full potential for finding economically feasible impacful solutions quicker.
Certainly, we can’t utilize something that we don’t know how it works. As indicated in the home page of this blog with a quote of Sol Spiegelman, scientists’ job should describe the elements that they have interest to work with. Hopefully, this inexpensive, fast, automatic, and informative method for measuring membrane permeability as cells grow can be useful to different scientist in their jobs.
References
1. Y. A. Osman, L. O. Ingram, Mechanism of ethanol inhibition of fermentation in Zymomonas mobilis CP4. J. Bacteriol. (1985).
2. M. Aeschbacher, C. A. Reinhardt, G. Zbinden, A rapid cell membrane permeability test using fluorescent dyes and flow cytometry. Cell Biol. Toxicol. 2, 247–55 (1986).
3. B. L. Roth, M. Poot, S. T. Yue, P. J. Millard, Bacterial viability and antibiotic susceptibility testing with SYTOX green nucleic acid stain. Appl. Environ. Microbiol. 63, 2421–31 (1997).
4. M. C. Santoscoy, L. R. Jarboe, Streamlined assessment of membrane permeability and its application to membrane engineering of Escherichia coli for octanoic acid tolerance. J. Ind. Microbiol. Biotechnol. 46, 843–853 (2019).
5. M. D. Rolfe et al., Lag phase is a distinct growth phase that prepares bacteria for exponential growth and involves transient metal accumulation. J. Bacteriol. 194, 686–701 (2012).


Comments